Upload
Add your results workbook, assessment task and marking guidelines. You can include several supporting files.
CSV, TSV, XLSX results · PDF, DOCX, TXT evidenceUpload an assessment, review the evidence and use the results to decide what to teach next.
Add your results workbook, assessment task and marking guidelines. You can include several supporting files.
CSV, TSV, XLSX results · PDF, DOCX, TXT evidenceCheck extracted maximum marks, question details and outcome suggestions. Atlas flags missing or conflicting evidence. You have the final say.
Direct links and parent-question context stay distinctExplore percentages, question graphs, student comparisons and confirmed outcome evidence. Class comparisons appear when teaching-group data is available.
See the marks and questions behind each insightReview the assessment story, add teacher feedback and generate your Teacher Pack, individual student reports or presentation.
Save a version to return to your reviewed evidenceExplore five prepared assessments. Open the analysis, inspect the report writing and download the presentation without uploading a file.
These examples use fictional results, authored question prompts and example mapping decisions. The mappings demonstrate the workflow and are not independently verified NESA alignment. English uses separately supplied rubric scores. Atlas does not infer criterion results from a single essay total. Opening an example does not upload or save it.
Switch between cohort, class and student perspectives. All data in this public example is fictional.
Interactive example · All results below are fictional. This demonstrates the report experience; it does not process real assessments.
Weighted by question marks
Two equally sized fictional classes
51% of available marks
Q6 has the lowest average in this fictional cohort. Look at the task criteria and student responses to investigate what students need next.
A concise assessment story, followed by question evidence and teaching priorities.
Complete example report · Fictional English Advanced assessment
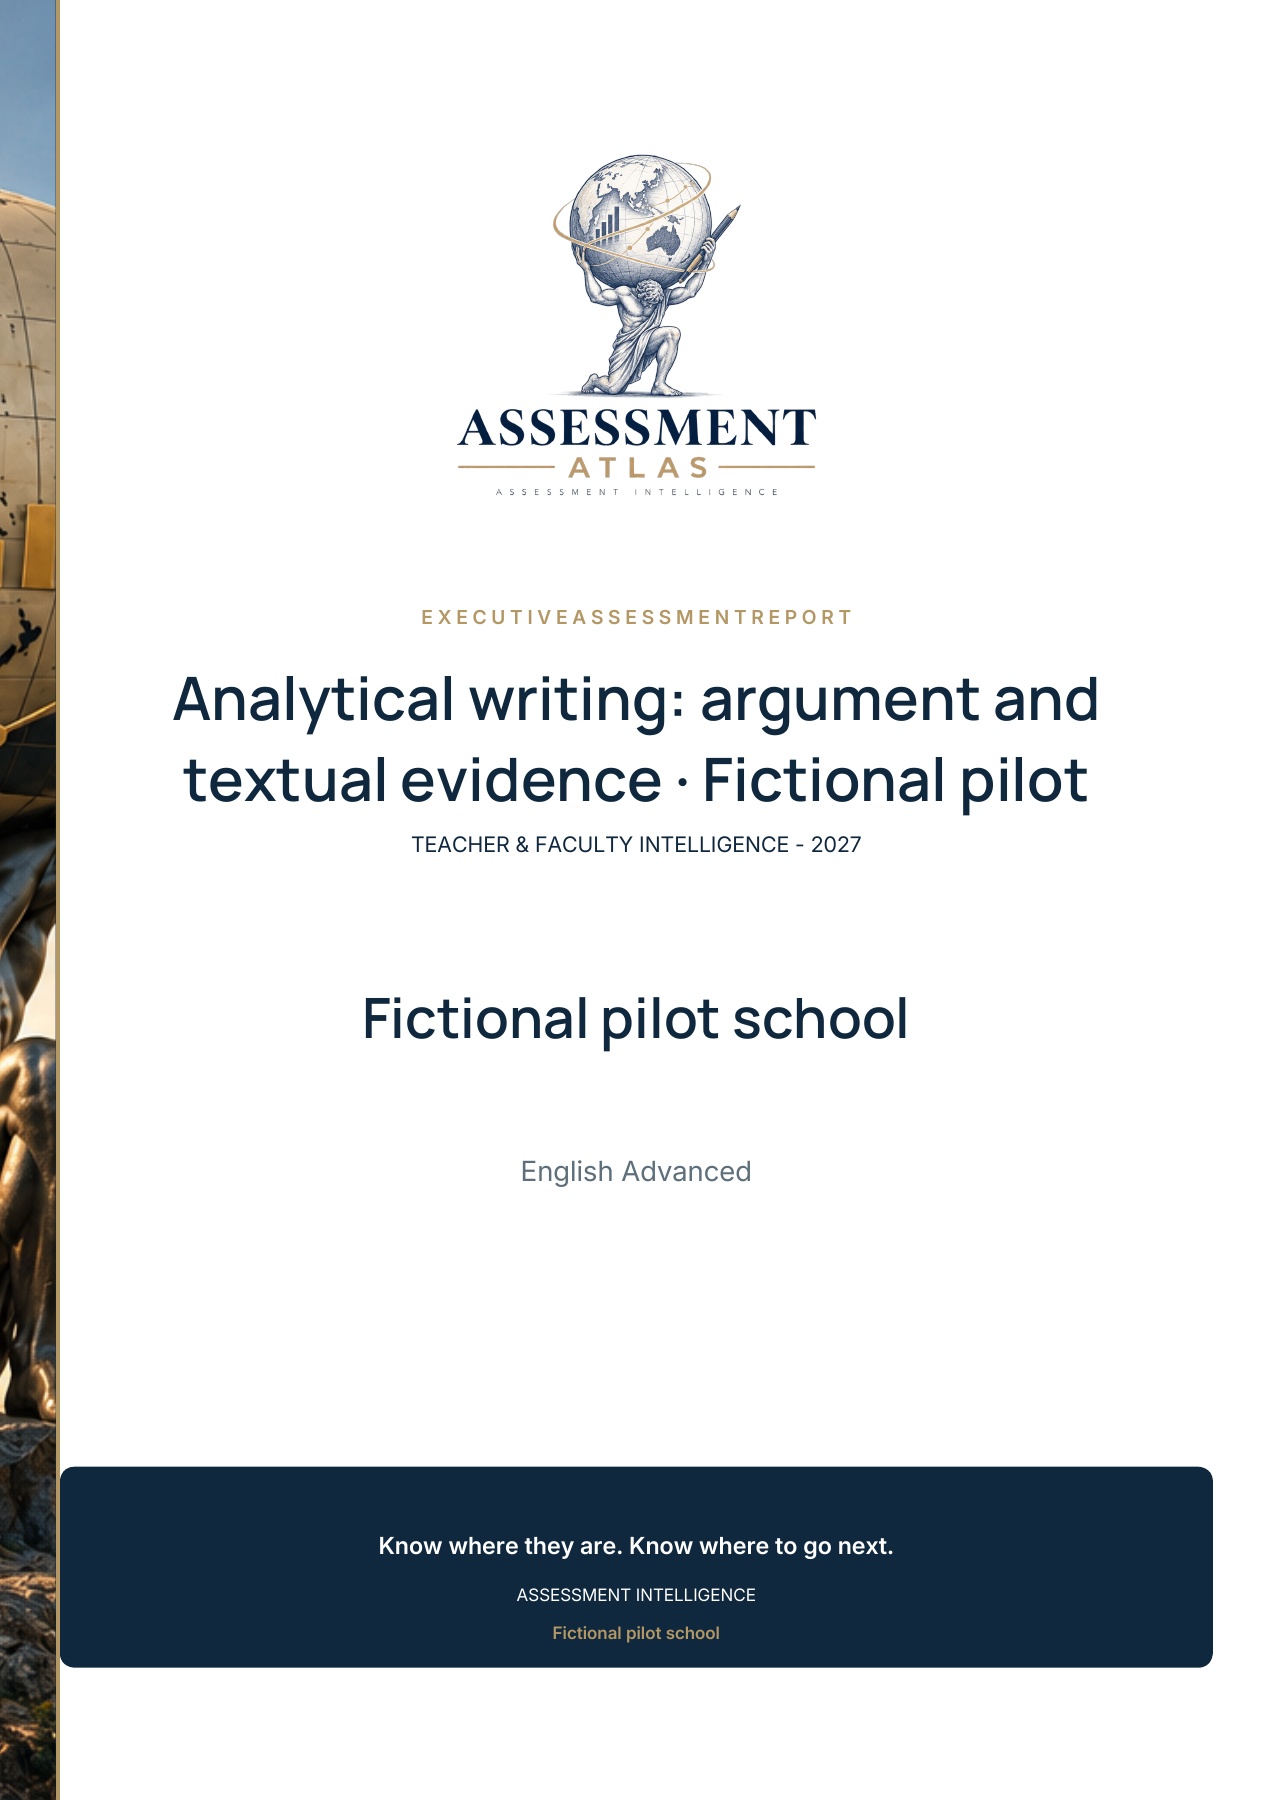
The report opens with its cover, followed by the assessment story and supporting evidence.
Actual A4 PDF examples using fictional results and a fictional school crest. Choose full colour or a printer-friendly greyscale version.
Student snapshot / full colour Student snapshot / printer-friendly
Teacher/class snapshot / full colour Teacher/class snapshot / printer-friendly
This preview shows the actual exported PDF, including its opening page. Results and teacher comments are authored fictional examples. Outcome mappings illustrate the workflow and are not independently verified curriculum alignment.
A readable assessment story, clear question results and space for the teacher’s feedback.
Complete example report · Fictional English Advanced assessment
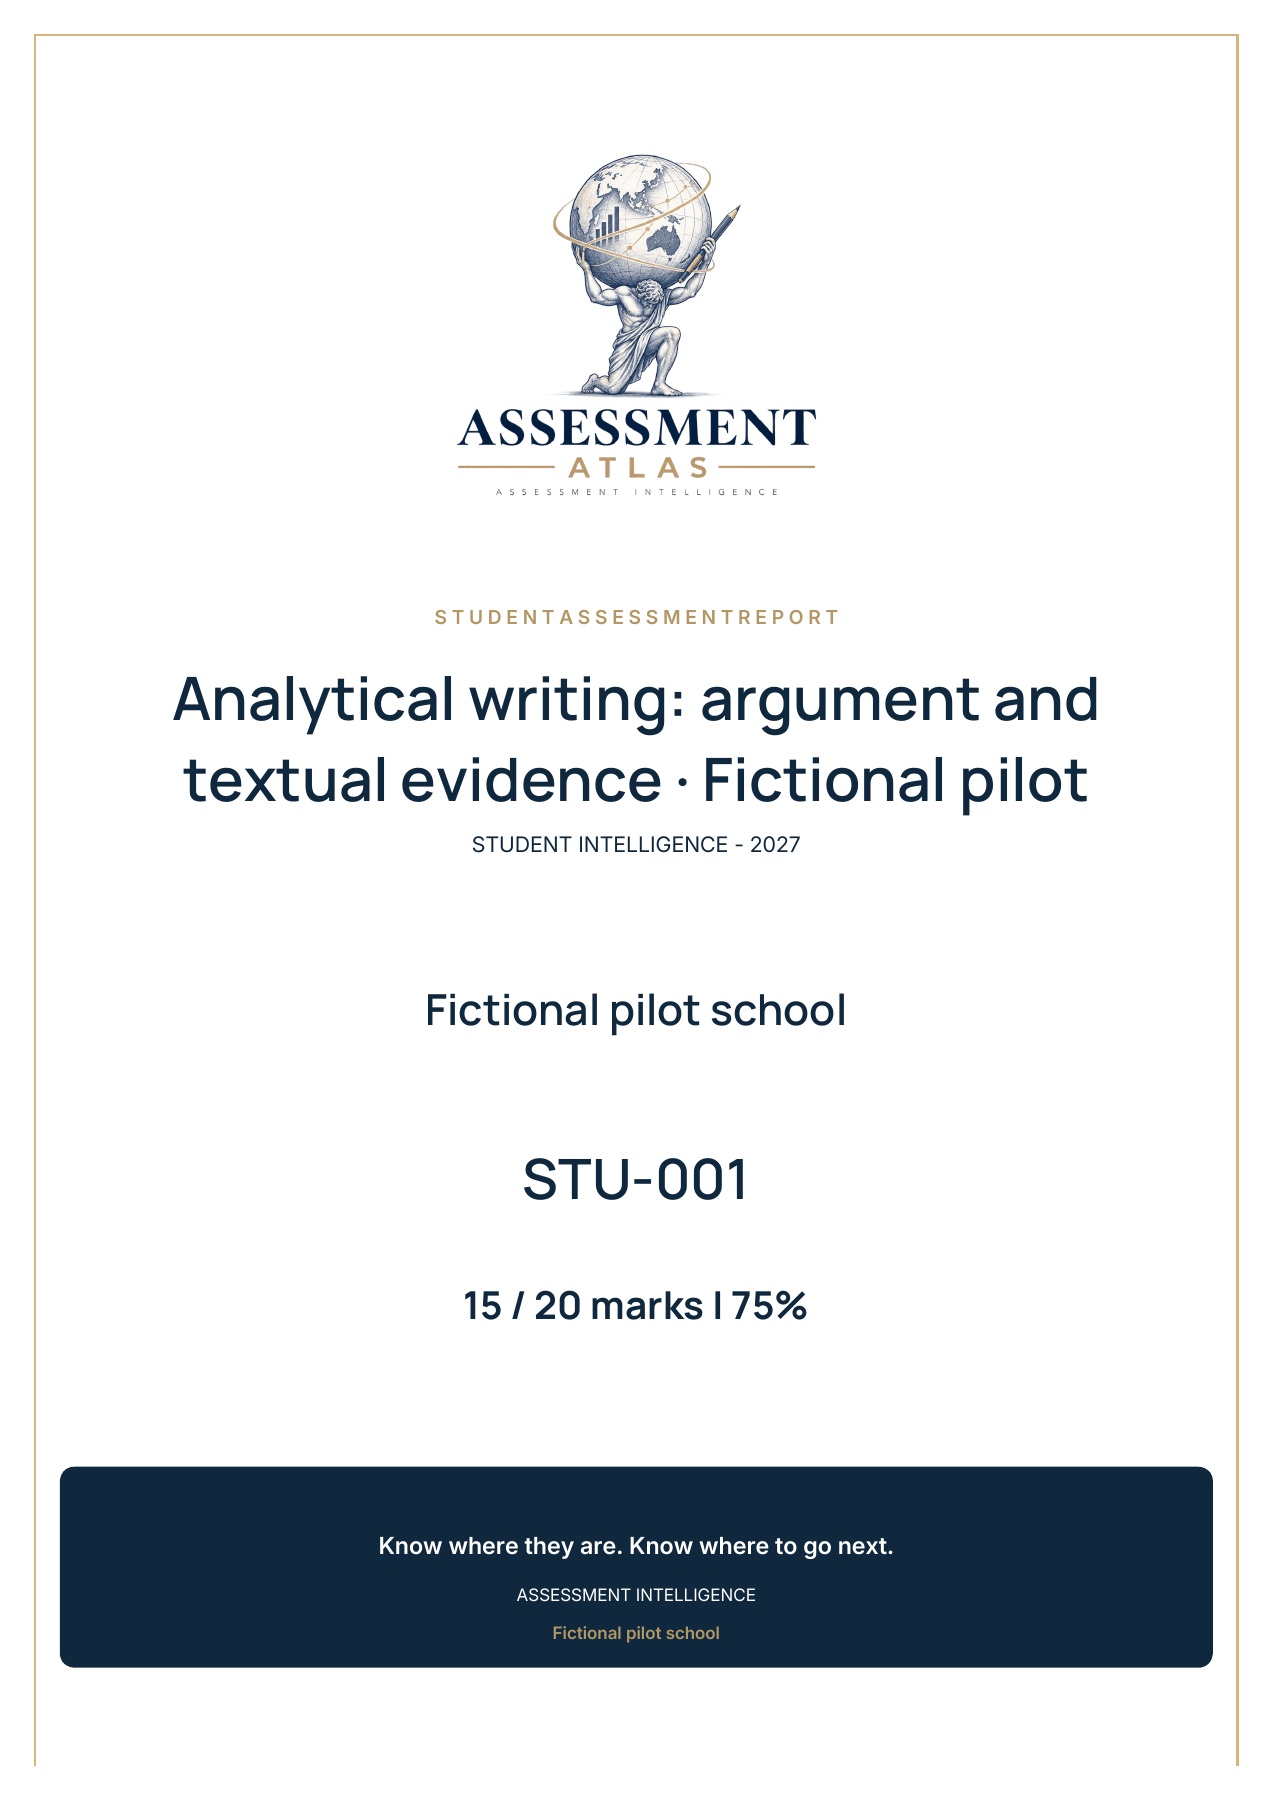
The report opens with its cover, followed by the assessment story and supporting evidence.
This preview shows the actual exported PDF, including its opening page. Results and teacher comments are authored fictional examples. Outcome mappings illustrate the workflow and are not independently verified curriculum alignment.
Present the assessment overview, question performance and teaching priorities in a consistent Atlas format.
Actual presentation preview · Fictional English Advanced assessment
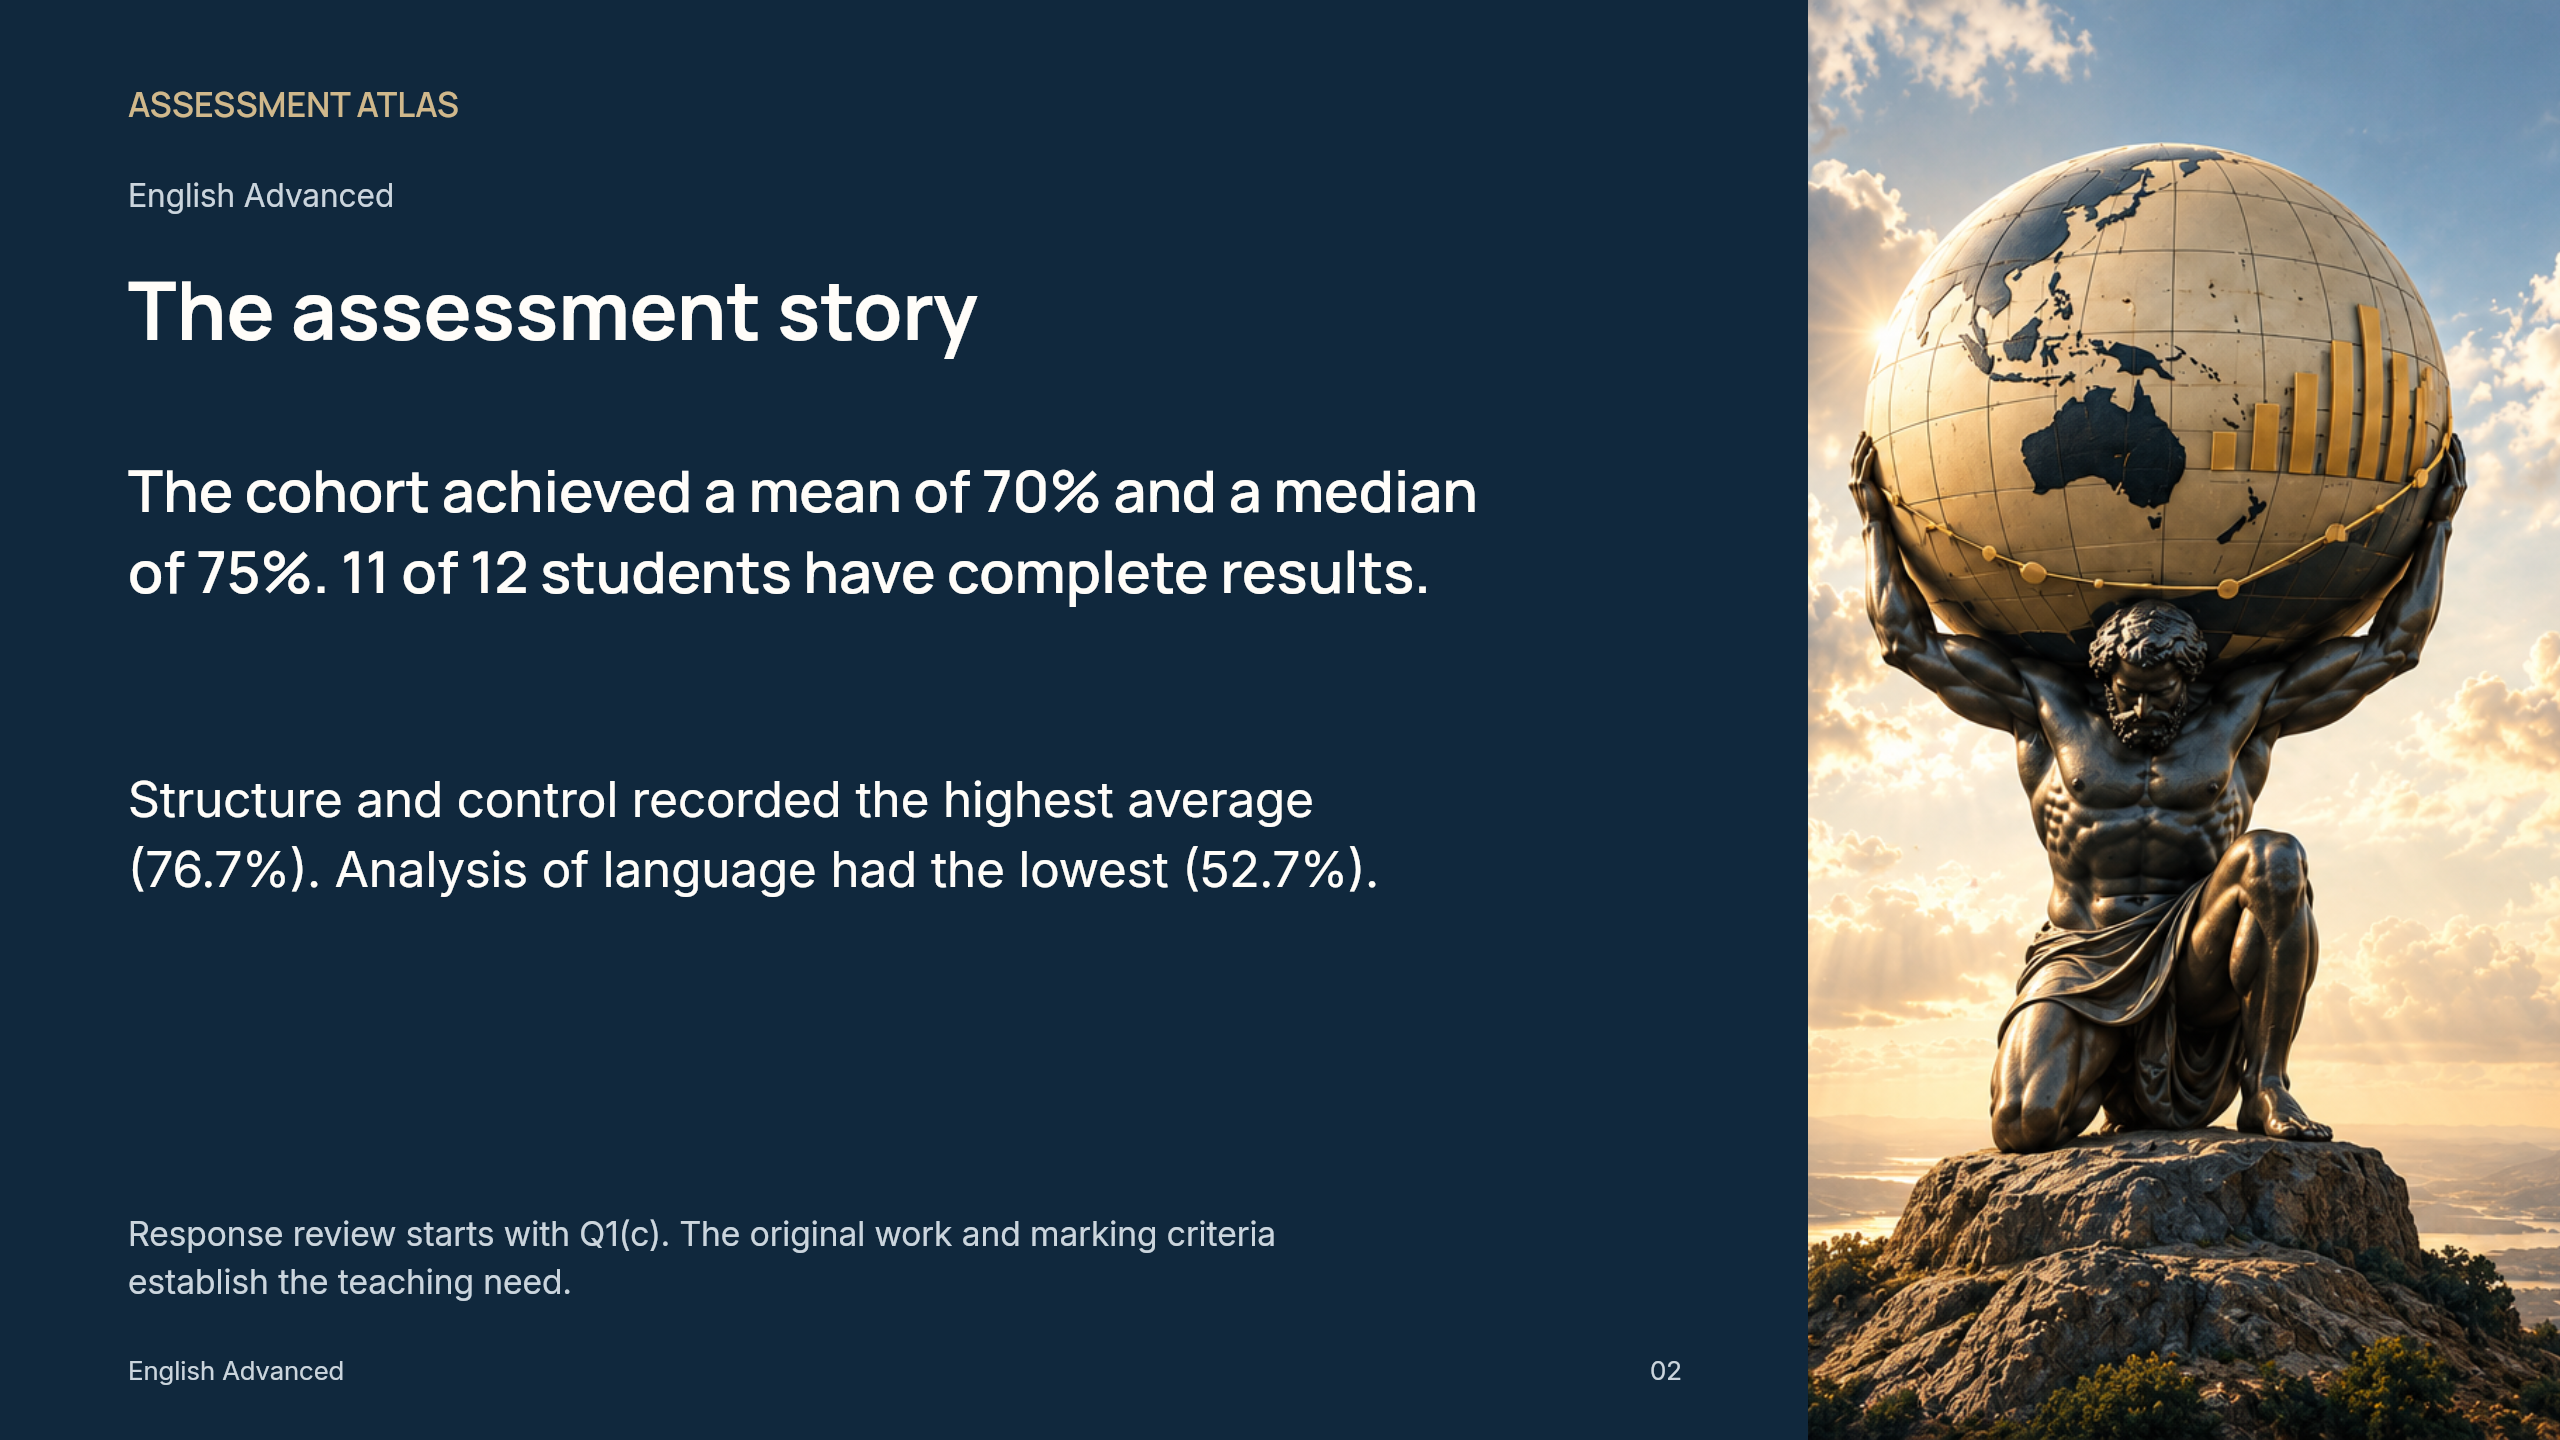
The complete presentation pairs clear analysis with crisp Atlas photography. Downloaded PowerPoint slides use native editable text and chart shapes. Results and outcome links are authored fictional examples.
Keep the selected course, syllabus version and question-to-outcome evidence together.
Selected Stage 6 profiles cover Health and Movement Science, Mathematics Advanced, Mathematics Extension 1, English Advanced, Biology and Chemistry. Coverage varies by course, year and syllabus version.
Atlas distinguishes direct question links, parent-question context and confirmed mappings. Parent context needs an explicit decision for each subpart. Percentages in the main outcome graph use confirmed links.
See how much of the assessment has confirmed mappings. An outcome without confirmed evidence is not labelled as low achievement or a gap in the wider teaching program.
Queensland, South Australia, Victoria, Western Australia, Tasmania, the ACT and the Northern Territory are planned. They are not presented as completed curriculum integrations.
What Atlas reads, what teachers review and what the examples demonstrate.
CSV, TSV or XLSX results, with PDF, DOCX or TXT task and supporting documents. Scanned PDFs need a selectable-text version; OCR is not included.
Atlas extracts explicit question marks where it can find them in the task or marking guidelines. Unclear or conflicting totals are flagged for review. It does not use the highest student score as the maximum.
The teacher. Direct source suggestions and parent-question context are labelled separately. Confirmed links feed the main outcome analysis; unconfirmed direct links can be explored in a separate preview.
Authorised teachers can use an optional local name key for comparisons and choose named exports. Saved assessment results use pseudonyms. Keep the name key separately and follow your school’s information-handling requirements.
Review detected questions and proposed mappings before analysis. Controlled examples cover several Maths, English and Science formats. Complex tables, equations, scanned files and unfamiliar layouts can need teacher review. A controlled example is not a guarantee that another assessment will extract correctly.
Explore course and year-group comparisons, confirmed multi-year series and evidence gaps. These examples use synthetic data and do not rank subjects or infer a school-wide average.
Live school reports are available only to the designated Head of Teaching and Learning and use the authorised school workspace’s branding.